Showing posts with label Derivatives. Show all posts

Saturday, 8 September 2012

Steepness in the Forward Volatility Term Structure

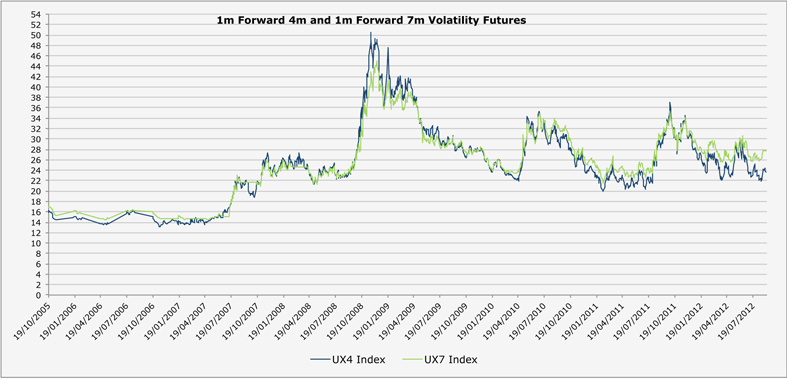
I was looking at the steepness in the forward implied volatility and found something interesting. Currently, in the wonderful VIX world, the 1 month forward volatility term structure is the steepest ever (99th percentile) over the last 7 years, when looking at the difference between the 7 month and 4 month forward contracts (UX7 Index and UX4 Index in Bloomberg). The difference is 4 vols.


The trade here, is to sell the 7 month and to buy the 4 month contract in order to benefit from the convergence between the two volatilities. So the position is paying decay. In order to figure out how much decay the position is inflicting, I had a look at the 1 month / 3 month contracts spread in order to assess the cost of carry. The difference is 5 vols, which means that, provided we hold the position until maturity, the cost of holding the spread is 1 vol.


Looking at the risk/reward, I believe that the maximum steepness between the two contracts will be 5 to 6 vols (losing 1 to 2), while the possible gain is of 4 to 6 vols. the risk/reward ratio seems appealing, while the cost of carrying the positing is one of the smallest since 2005.

Why is the forward term structure so steep? 

I think that at the moment, we are in a world of financial repression where equity and bond markets are wherever central banks want them to be. The greater the level of monetary expansion, the calmer the VIX and the higher the gains in the S&P Index.

So, as realised volatility is poor and the equity market is rallying, implied volatilities are drifting lower and lower (even to truly absurd levels given the state of our economies), especially in the front end of the term structure. However, market participants still expect volatility to pick up in the future. 

So in a certain way, we go back to the same question, which is how long our politicians and central bankers can kick the can down the road and avoid confronting the real issues.

Monday, 3 September 2012

Bearish Trading Strategy - with a twist


If you are bearish on an underlying, on low implied volatility names, you can:
-        Buy a naked put spread
-        Buy a put (hedged)
-        Buy an upside call (hedged)

Let's talk about the last trading strategy. It sounds counterintuitive, however, let's have a closer look. 

The interesting part is that, on a low implied volatility / high convexity underlying, the return is higher than on a hedged long put. See the detailed analysis below, for an instantaneous 5% down move.

Notes:
-         As the spot moves down by 5%, implied volatility follows the skew and is readjusted. Lets imagine (and this is purely fictive) that implied volatility moves up by 1% (fixed strike). Also, as we move away from our call, its implied volatility increases more (convexity). So we considered that for the call, the adjustment is 2 vols (This is an rough estimate - no science behind)
-        Being long the call, we end up with 9% delta, so we are still a bit short shares. Being long the put creates a larger delta position, so we are more and more long shares of a crashing underlying.
-        The highest performance is from the put spread strategy, we left it as a benchmark.

Monday, 27 August 2012

Equity Volatility Skew


Equity Volatility Skew

Equity Volatility Skew, sometimes called strike skew, is the measure of the disparity of option implied volatility for option contracts with different strikes but the same expiration. It is the extrapolated tangent between two given strikes implied volatility, and thus a slope.
                                                                                        
In equities, most of the time, it has a negative slope and is expressed by moneyness as the arithmetic difference between implied volatility of the 90% put option and the implied volatility of the 110% call option. It can also be expressed by strike (sticky strike, vol by constant strikes) or by delta (sticky delta, vol by delta constant).

Source: Bloomberg

Skew and Black Scholes

Existence of Strike skew is not predicted by the Black-Scholes model. Black Scholes model assumes that volatility is a property of the underlying instrument, so the same implied volatility value should be observed across all options on the same instrument.

Equity volatility skew is a consequence of empirical violations of the black Sholes stock prices return distribution assumptions. Indeed, the Black-Scholes model assumes that stock prices are lognormally distributed, which in turn implies that stock log-prices are normally distributed.


Reasons for a Skew

Empirical: Market returns are more leptokurtic than assumed in by the lognormal distribution. Market leptokurtosis would make way out-of-the-money or way in-the-money options more expensive than would be assumed by the Black-Scholes formulation. So by increasing prices for such options (and thus implied volatility), existence of implied volatility skew is a way of achieving higher prices than within the Black-Scholes model.

Statistical: Markets tend to fall harder than they rise and skewness is a measure of the asymmetry of the distribution. Being the 3rd standardized moment and representing this asymmetry, skewness expresses in a certain way the observed correlation between the move of a random process and its volatility (on this - to assess the risk neutral distribution asymmetry implied by an option, a theoretical framework or model is needed)

Behavourial: Volatility skew could reflect investors fear of market crashes, as deeply out of the money puts are a form of insurance against market crashes. As they are considered as low cost in terms of dollars, deeply out of the money puts are widely used as a protection tools. Thus, skew can be seen as the perceived tail risk of the distribution of the market and can be a valuable indicator that shows the market sentiment toward a given underlying.

Structural Demand and Supply: The market is ‘long stock’, so investors naturally tend to sell high strike calls options (to enhance the yield of the portfolio through income) and to buy puts options in order to protect the portfolio returns.


Use of the skew:

The first thing is that there is not a single measure of equity volatility skew that is unambiguously best for all purposes. In fact, skew is dependent from volatility level, maturity, spot price. A very interesting way of expressing skew is (25 delta put volatility-25 delta call volatility) / 50 delta volatility, which emerges as the preferred skew measure based on the theoretical and empirical analysis.

Predictive power of returns: Academics tend to suggest that there is predictive information content within the volatility skew, especially in the short-term for stock market returns. However, market practitioners tend to make no money from such findings. So it seems that there is no clear empirical relationship... Sorry guys.

There have been many attempts in the academic literature to model the behavior of changes in skew, but the interpretation of skew information by traders is still done largely on a qualitative and ad hoc basis.


Trading Skew

An experienced trader explained me a rule of thumb, 10 delta difference between 2 options should roughly equate to 1 vol difference. Skew will be expensive if above 1.5 and cheap if below 0.5.

Risk Reversals, Put Spreads and Call Spreads are skew trading strategies. The main drawbacks when entering such king of strategy is that realisation of the skew will be impacted by vol level and spot level, so a decent amount of noise will come affect the trade. As the trade is done, moneyless/delta of the options is affected by the spot and/or volatility changes and passage of time.

Also, when trading short term options (less than 3m, for example) most of skew buying strategies tend to have poor gamma/theta ratios. In other words owning gamma via puts with high skews can be expensive in terms of theta decay compared to a portfolio made up of at-the-money or call options.

Monday, 13 August 2012

Let The Good Times Roll (European Equities and Credit)


The relationship between stock price volatility and CDS spread is statistically strong, with a historical correlation close to 0.70 in both regions.

Below, a comparison of current Volatility and Credit levels
-       Volatility is measured as V2X and VIX
-       Credit is measured as Markit Itraxx Europe and USA Generic 5Y corporate CDS (basket of 125 cds for each)
Source: Bloomberg

And the graphic representation of historical levels since 2004
Source: Bloomberg


Source: Bloomberg

Today, credit is in 80th percentile and 63rd percentile in Europe and USA, respectively while equity volatility is in the 52nd percentile and 34th percentile. In Europe, the spread is particularly large. This conflicting signal puzzles me, especially if I look at the following items (the list could be long):
-        Spain 10Y still above 6.80%, around crisis levels
-        Still potential breakup of the eurozone, with all the mess it implies
-        ESM  still not in place and no clear support for a banking license that will allow the entity to fund itself
-        ECB bond purchases seniority issue not resolved, pushing private investors down the pecking order of creditors
-        Deterioration of corporate earnings and economic indicators

From the other hand, the spread between equity volatility and credit could remain at high levels
-        The performance of equity markets is not that bad (+5.4% so far in 2012), served by relatively better yields than in the rates market and low valuation
-        The CDS index has 25% of financial companies against 22% for the Equity index, explaining part of the difference
-        Also, CDS has underperformed vs Cash, due to the lack of liquidity in the cash market and positive basis

As the answer will come from our politics, so the catalysts to look at in September are the following:
-       6th Sep : ECB Meeting :  SMP details?
-        12th Sep : Constitutional court of Karlsruhe for ESM vote
-        13th Sep: Fed meeting: QE3 or not QE3?
-        15th Sep : Euro Group meeting

What history tells us:

From Luc Laeven and Fabian Valencia, IMF : "An interesting pattern emerges: banking crises tend to start in the second half of the year, with large September and December effects."

From Roggof, Harvard: crises to happen in election years. The intuition behind is that crises are the result of imbalances that accumulate over a long time. Politicians have a strong incentive to delay dealing with them until after an election, and often, as was the case with Greece, to actually hide the truth until the polls close. We had Elections in France, and US and China leadership transition on the agenda.

Personally, I tend to think that August will probably remain quiet. 
However, I am really worried about September 12, Equity volatility should explode. 

So let’s enjoy the end of the summer while it lasts.